.jpg)
The lake between the Niagara and St. Lawrence rivers
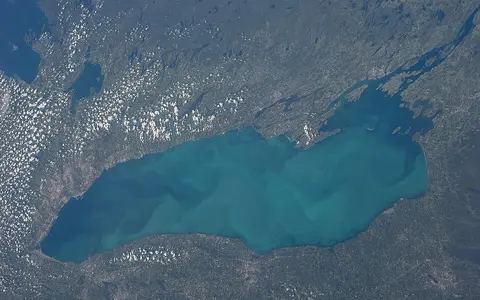
This record covers the physical water body called Lake Ontario: the broad lake east of the Niagara River mouth and west of the channel that becomes the upper St. Lawrence River near Kingston, Ontario, and Cape Vincent, New York. The Niagara River, Niagara Falls, St. Lawrence River, Welland Canal and surrounding drainage basin are connected features, not parts of the lake itself. The political boundary crosses the water; it does not divide the lake into separate physical basins. Canada's names database classifies the feature as a lake polygon and recognizes both Lake Ontario and Lac Ontario as official names.[1]
The official Canadian polygon carries the locating coordinate 43°43′44″ N, 78°06′23″ W (43.7288366, −78.1064044), at a stated relevance scale of 1:5,000,000. This is a useful map reference, not a surveyed centroid, deepest point or definition of the international boundary. The western end lies between the Niagara Peninsula and Hamilton; the long north shore passes Toronto and Prince Edward County, while the south shore passes Rochester and Oswego before the lake narrows among islands and shoals at its northeastern outlet.[1][5]
Area, depth and datum are different kinds of figures
The U.S. Environmental Protection Agency's coordinated Great Lakes table gives a water area of 18,960 km² (7,340 mi²), volume of 1,640 km³ (393 mi³), mean depth of 86 m (283 ft) and maximum depth of 244 m (802 ft). The depth and volume figures are explicitly measured at low water. Its conventional shoreline length is 1,146 km (712 mi), including islands; shoreline length changes with map scale and the treatment of small islands and inlets, so it is not an exact perimeter.[2]
For Lake Ontario, chart depths use a Low Water Datum of 74.2 m (243.3 ft) on International Great Lakes Datum 1985. That value is a navigation reference plane, not the lake's fixed surface elevation. Observed water levels move above and occasionally toward that plane as supply, outflow, wind and atmospheric pressure vary. IGLD 1985 remains in operational use while the binational IGLD 2020 update is prepared, with tentative release scheduled for 2027.[3]
Measurement conventions explain some apparently contradictory statistics. NOAA's status dashboard maps 19,009 km², 49 km² more than the coordinated 18,960 km² figure, but does not state an equivalent polygon method; this page therefore keeps the coordinated value rather than blending the two. EPA gives a six-year hydraulic retention estimate, whereas a 2023 NOAA modeling report repeats an approximately eight-year estimate from an older study. Retention is volume divided by an assumed mean outflow, not the measured age of every water parcel, so the six-year coordinated value is used only as a convention, not a timeless residence time.[2][5][10]
Four troughs along an asymmetric floor
NOAA's bathymetric compilation resolves four axial basins from west to east: Niagara, Mississauga, Genesee and Rochester. Three intervening ridges separate them, but gaps connect the deep axis from one basin to the next. West of the Niagara mouth the axis lies near the middle of the lake; farther east it shifts toward the New York shore. The Rochester Basin is the deepest. Its floor carries parallel northeast–southwest ridges with about 15–25 m of relief and natural spacing of roughly 250–1,000 m, interpreted from seismic and core evidence as glacial landforms preserved beneath lake sediment.[4]
The northeastern end is a different setting from the open central lake. Duck–Galloo Ridge and the Kingston, Galloo and Stony basins lead toward the shoal- and island-rich St. Lawrence approach; many of those small basins are generally shallower than 40 m. Along the central north margin, the Scotch Bonnet and Point Petre ridges overlie bedrock highs, and the Cobourg Valley appears to continue the alignment of the Bay of Quinte beneath the lake. These named submerged features give the basin its spatial structure and show why one mean-depth value cannot describe the floor.[4]
Niagara → Mississauga
The western troughs begin beyond the Niagara sediment fan and connect through a deep gap.
Genesee → Rochester
The axis approaches the south shore and reaches the lake maximum in the Rochester Basin.
Ridges, shoals and small basins
The simple open-water outline breaks into a more complex submerged approach to the St. Lawrence.
Older rock structure, glacial excavation and a changing outlet
The basin follows southward-dipping Paleozoic sedimentary rocks. More resistant limestone and weaker shale and red-bed units created unequal resistance to erosion, while preglacial streams had already cut valleys into the bedrock. Repeated Pleistocene ice advances enlarged and reorganized that relief. NOAA treats some ledges and channels as products of Wisconsin glacial erosion or subglacial meltwater acting on layered rock, but the relative role of each process remains an interpretation rather than a directly measured event.[4][7]
Seismic profiles and sediment cores preserve the later sequence. USGS mapped probable subglacial till and an ice-marginal western unit associated with retreat shortly after 13,000 years ago; widespread laminated clay accumulated in glacial lakes until about 11,000 years ago. After high-level Lake Iroquois and successor lakes drained, lake clay changed as water supply and level changed. Modern lake clay, generally less than 10 m thick in that framework, began accumulating about 6,000–8,000 years ago when upper Great Lakes drainage returned through the Ontario basin. These ages describe deposits and drainage stages, not the age of the bedrock or of the present shoreline.[7]
A high-energy rim with sheltered exceptions
The lake margin is not uniformly mud-floored. NOAA found that circulation has prevented widespread accumulation of postglacial mud around much of the perimeter, except in sheltered settings. Between Niagara and Oshawa, mapped bottom materials include exposed bedrock, boulder pavement, sand and glacial drift. Around the wider lake, linear nearshore relief repeatedly records glacial shaping or bedrock topography re-exposed by waves and currents.[4]
Above water, that inheritance appears as low glacial plains, bluffs, beaches and enclosed or partly enclosed embayments. Irondequoit Bay forms a large south-shore indentation, the Bay of Quinte aligns with a submerged valley on the north side, and the northeastern outlet has far more bedrock-controlled islands and shoals than the central shores. Waves erode exposed bluffs and sort the released sand alongshore, while storms and changing lake level shift the active zone up and down the beach. The 1,146 km shoreline statistic therefore describes one mapped convention, not a fixed line immune to erosion, deposition or water-level change.[2][4]
About 85% of supply arrives from Lake Erie
On average, Lake Erie supplies about 85% of Lake Ontario's inflow, mostly through the Niagara River. The Niagara contribution is not controlled by a river dam; it varies chiefly with Lake Erie level and averages only about 11% seasonal variation, with the highest inflow typically in June and the lowest in February. Local tributaries—including the Genesee, Oswego, Salmon and Black rivers in New York and the Humber and Don rivers in Ontario—plus runoff and precipitation over the lake make up the local side of the water budget; evaporation is a loss from it.[5][6]
Water leaves at the northeast through the St. Lawrence River. Since 2017, Plan 2014 has set weekly Lake Ontario outflows according to lake level, water supply and conditions upstream and downstream on the river. That regulation occurs at the Moses–Saunders project downstream; it does not eliminate natural variation in Niagara inflow, precipitation, runoff, evaporation or wind. This distinction is important: the lake is regulated at its outlet, but its level is not held at a single elevation.[8]
Seasonal storage, wind setup and internal circulation
Basin-wide levels generally rise through spring, when runoff increases and evaporation is limited, and tend to peak in early summer; they commonly reach their seasonal low in late autumn or early winter as evaporation strengthens. Multi-year wet and dry periods alter total storage. Over hours, sustained wind can push water toward one end of the lake, a temporary wind setup; after the forcing weakens, the water can oscillate as a seiche, a standing wave in the basin. IJC reports local wind surges up to about 0.5 m, distinct from a lake-wide 0.5 m rise.[6]
The deep lake normally develops thermal stratification from about late June through October: warm, less-dense surface water overlies colder deep water until autumn mixing. Under prevailing summer southwesterly winds, NOAA's model review describes frequent upwelling of cold deep water along the north shore and downwelling along the south shore. Upwelling is the rise of deeper water toward the surface; downwelling is the compensating descent. These motions and the later alongshore relaxation redistribute heat without changing the lake's total water volume.[5]
Deep-water heat storage limits ice and feeds snow bands
An 86 m mean depth gives the lake substantial heat storage, so offshore water usually remains open even while bays and nearshore areas freeze. Ice extent is nevertheless highly variable: NOAA's Lake Ontario series reports annual maximum percentage cover from 1979 through 2025 rather than a single characteristic value. Ice cover, stratification and the timing of spring warming should therefore be treated as year-dependent conditions, not permanent attributes.[5][10]
In late autumn and winter, cold air crossing relatively warm open water gains heat and moisture. The resulting clouds and snow form downwind, and wind direction controls where the bands make landfall. Flow aligned with Lake Ontario's long east–west fetch can organize a narrow, intense band; the Tug Hill Plateau between Watertown and Syracuse lies directly east of that long fetch. The process is geographically specific to wind, open-water length and temperature contrast, so “lake effect” does not imply equally heavy snow on every shore.[9]
Sources and measurement notes
- Geographical Names Board of Canada, Canadian Geographical Names Database, Lake Ontario (key FAYLN) and Lac Ontario (key FEHRO), official lake-polygon records, decision date 18 February 1994, records modified 16 February 2021 (accessed 29 August 2026). Sources for feature type, official names, locating coordinate and its 1:5,000,000 relevance scale.
- U.S. Environmental Protection Agency, Physical Features of the Great Lakes (updated 31 October 2025; accessed 29 August 2026), drawing its coordinated figures from the Coordinating Committee on Great Lakes Basic Hydraulic and Hydrologic Data. Source for surface area, low-water depth and volume, island-inclusive shoreline length and the six-year retention convention.
- NOAA Center for Operational Oceanographic Products and Services, Great Lakes Low Water Datums and International Great Lakes Datum (accessed 29 August 2026). Sources for Lake Ontario's 74.2 m chart datum on IGLD 1985, current operational-datum status and the tentative IGLD 2020 release schedule.
- NOAA National Centers for Environmental Information, Bathymetry of Lake Ontario and companion Geomorphology documentation (accessed 29 August 2026). The compilation combines U.S. and Canadian hydrographic surveys. Source for axial basins, ridges, outlet bathymetry, bedrock controls, lake-margin materials and qualified glacial interpretations.
- Kelley, J. G. W., Chen, Y., Anderson, E. J., Lang, G. A., Peng, M. and Rivin, I., Upgrade of NOS Lake Ontario Operational Forecast System to FVCOM: Model Development and Hindcast Skill Assessment, NOAA Technical Memorandum NOS CS 56 (April 2023), pp. 3–4 (accessed 29 August 2026). Source for generalized length and width, tributary orientation, seasonal stratification, wind-driven upwelling and the alternative eight-year retention estimate. EPA's coordinated 1,640 km³ volume is retained instead of the memorandum's inconsistent paired rounding.
- International Joint Commission, International Lake Ontario–St. Lawrence River Board, Influences on Water Levels and Flows (accessed 29 August 2026). Source for the 85% Lake Erie contribution, Niagara inflow seasonality, local water-budget components, annual level cycle, wind setup and seiches.
- Hutchinson, D. R., Lewis, C. F. M. and Hund, G., Regional Stratigraphic Framework of Surficial Sediments and Bedrock Beneath Lake Ontario, Géographie physique et Quaternaire, 1993, DOI 10.7202/032962ar (accessed 29 August 2026). Source for seismic-profile methods, preglacial valleys, glacial and postglacial sediment units, qualified interpretations and age ranges.
- International Joint Commission, International Lake Ontario–St. Lawrence River Board, Lake Ontario–St. Lawrence River Regulation (accessed 29 August 2026). Source for Plan 2014, weekly outflow decisions and the distinction between controlled outlet flow and uncontrolled natural water supplies.
- Niziol, T., NOAA National Weather Service, Lake Effect Snow: How Does It Affect Your Day of Flying?, The Front 5(1), February 2005 (accessed 29 August 2026). Source for the heat-and-moisture mechanism, wind and fetch controls, single-band organization and Tug Hill's downwind position.
- NOAA National Marine Ecosystem Status, Lake Ontario indicator record (ice series through 2025; accessed 29 August 2026). Source for the independently mapped 19,009 km² area and the definition, period and source lineage of annual maximum ice-cover percentage.